

User manual
Introduction
My Account
My Timelines
Create and edit a timeline
Export and import
Create and edit an event or period
Vertical view
Horizontal view
Troubleshooting
Horizontal view
Events and periods
The horizontal view represents events on a continuous time axis, making it possible to see at a glance the chronological relationship between events and periods, their overlaps and the time distance between them.
Each event or period appears as a card positioned in its corresponding chronological location. The card shows the date, the title and, when available, the main image of the event or period.
Clicking a card opens the details window for that event or period. From that window, you can view the full information: description, dates, tags, attachments, main image and available external resources.
If an event or period uses date modifiers, TimeDivers calculates its actual position on the time axis from the reference date used. This makes it possible to represent relative events accurately, even when they depend on another date in the same timeline.
For periods, the horizontal view visually shows their duration on the time axis, making it possible to see the interval they occupy and how they relate to other events or periods.
When several events are concentrated in a specific area of the chronology, the horizontal view distributes the cards to make them easier to read and prevent visual overlap.
Controls
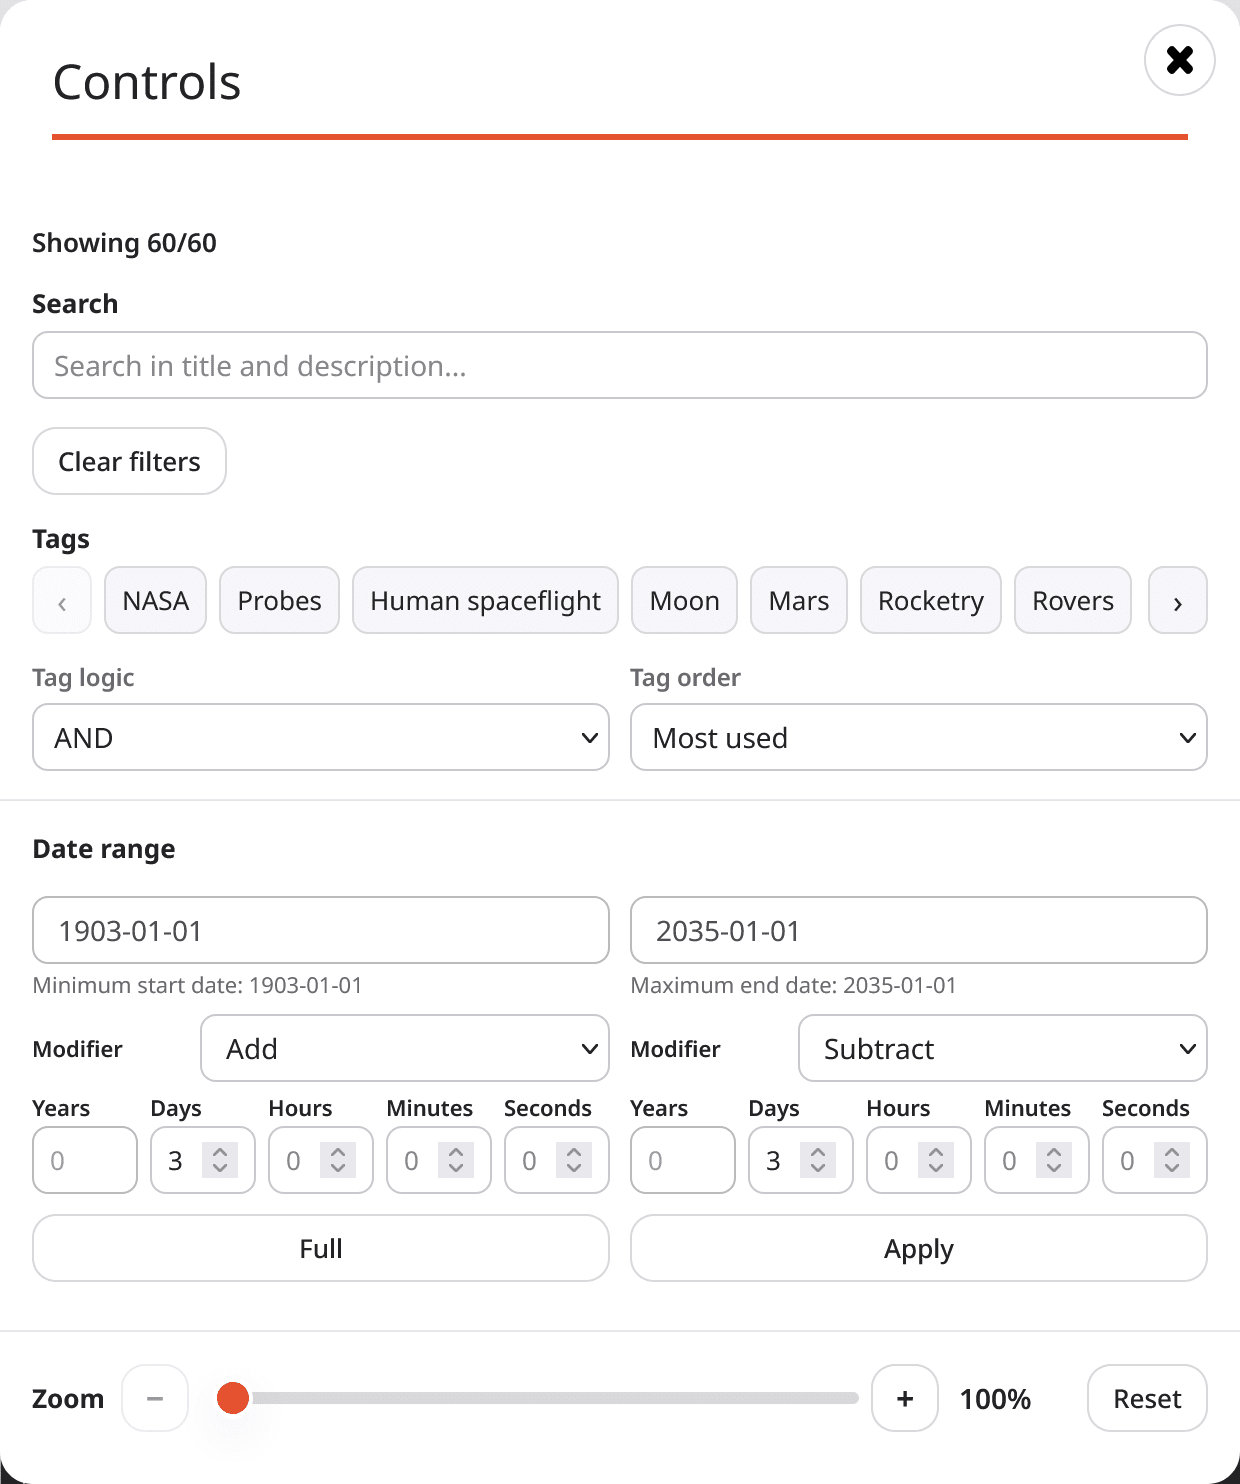
The Controls window brings together all the tools needed to adapt the timeline display and quickly locate the information you need at any given time.
At the top, you can see how many events are currently being displayed and how many exist in total. For example, the indication “Showing 60/60” means that all events in the timeline are visible with the current settings.
At any time, the Clear filters button removes all active filters and restores the display to its initial state.
Search
The search field allows you to find words or phrases within event titles and descriptions. Results update automatically as you type.
Tags
The tags section allows you to search for specific tags and activate or deactivate them as filters. It is also possible to decide how the available tags are displayed, ordered from most to least used or alphabetically.
The Tag logic option determines how active filters are combined. With the AND option, an event must contain all selected tags to appear on screen. With the OR option, it is enough for it to contain any of them.
Date range
The Date range section allows you to limit the horizontal view to a specific interval. You can enter a start date and an end date and apply the range to focus the display on that period.
By default, the widest display range is determined by the dates of the first and last event or period in the timeline. Custom ranges must always be defined within those limits.
This capability is one of TimeDivers’ most powerful features. A single timeline can span from billions of years to events separated by only seconds. Thanks to custom ranges, the user can move from a global view of the entire chronology to an extremely precise analysis of any interval, while maintaining smooth navigation and accurate event positioning.
The modifiers available in the date range allow you to adjust the interval limits without having to calculate new dates manually.
Zoom
The horizontal view has an adjustable zoom level between 100% and 3200%.
Zoom allows you to progressively enlarge the time scale to separate events that are very close together and make them easier to consult without losing the reference of the overall chronology.
When even the maximum zoom level is not enough, it can be combined with custom date ranges, achieving an even greater level of precision. The combination of both tools allows you to navigate comfortably through chronologies of any scale, from historical processes of enormous duration to sequences of events separated by minutes or seconds.
The Reset button restores the initial zoom level.
Share
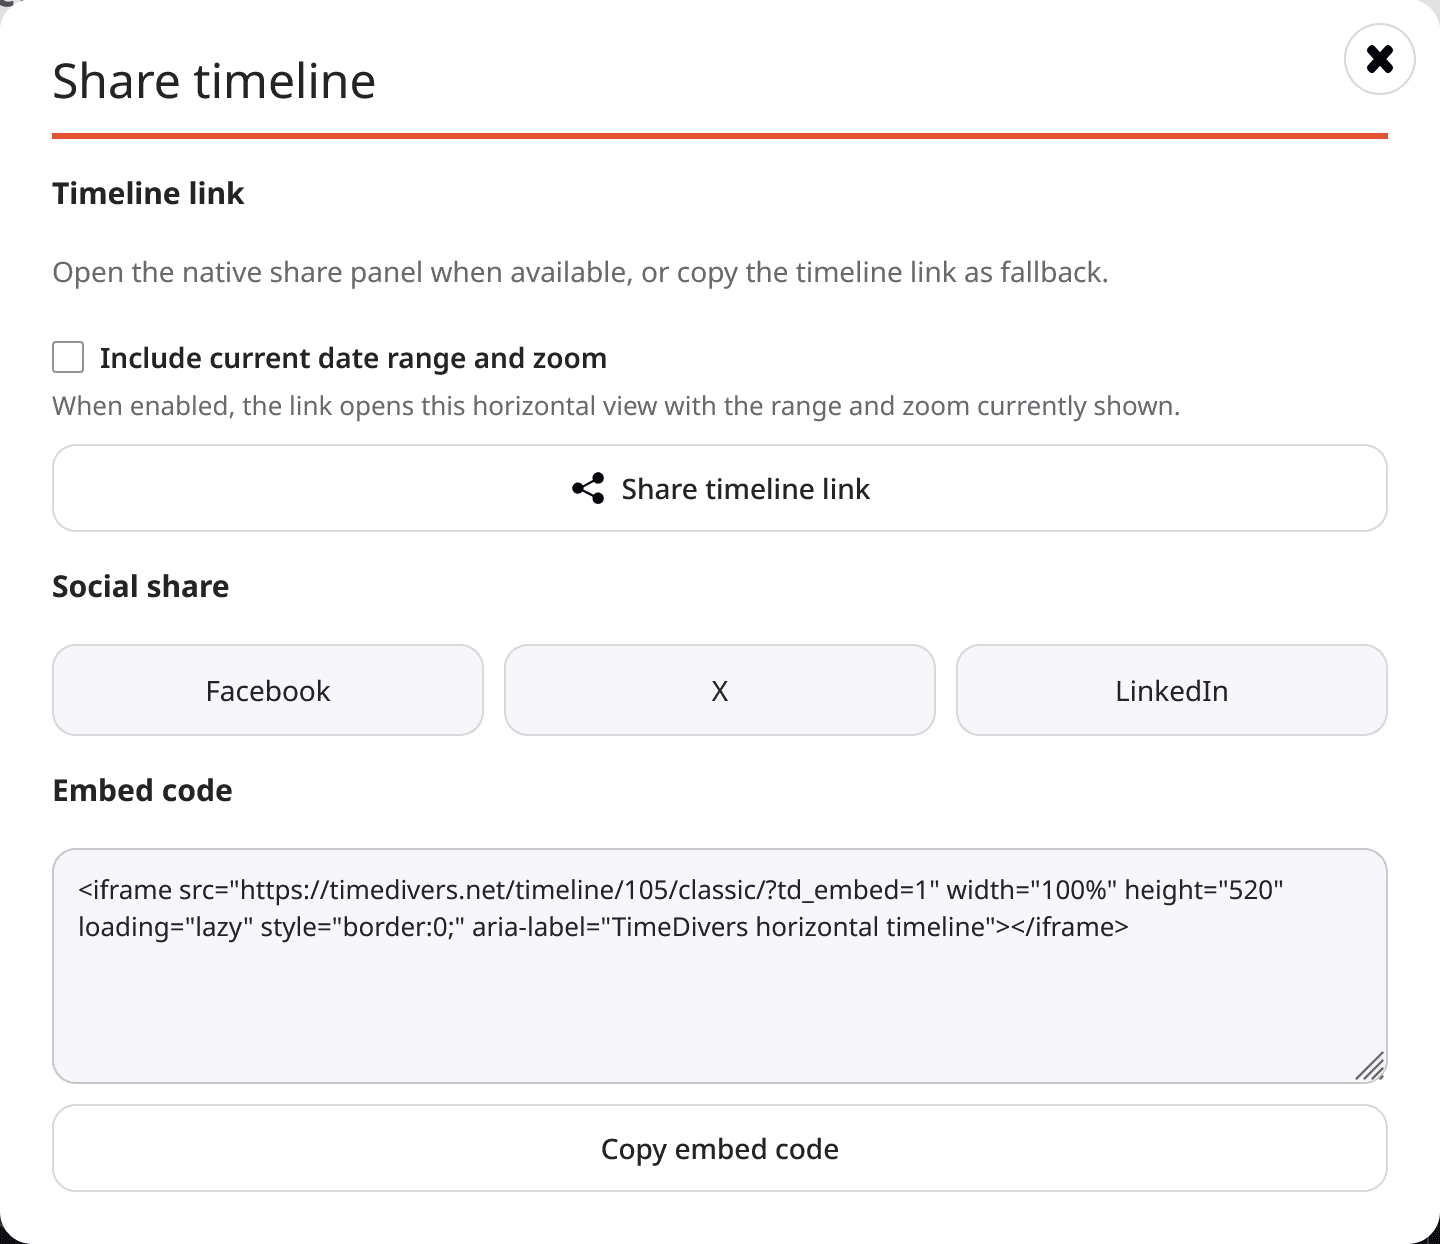
The Share window in the horizontal view allows you to share the complete timeline.
From this window, you can use the sharing options provided by the browser or device. If that function is not available, TimeDivers copies the timeline URL to the clipboard.
The horizontal view includes a specific option to share the current date range and zoom level. If you activate this option, the generated link will open the timeline with the same time interval and zoom level that you are viewing at that moment.
The window also offers shortcuts for sharing the timeline on social networks and an option to obtain the embed code.
How to embed a timeline
To insert a timeline into another website, open the Share window and copy the embed code.
The code uses an iframe. You can paste it into a web page, blog post, virtual campus, intranet or any environment that allows HTML embedding.
The embedded timeline is fully operational: it allows users to navigate through events and periods, open the details window and use the options available in the embedded view.
You can customise the width and height values in the embed code. Both parameters can be indicated in pixels (px) or as a percentage (%).
A value in pixels sets an exact size. For example, width="900px" displays the timeline with a width of 900 pixels.
A percentage value makes the timeline occupy part of the available space. For example, width="100%" makes it use the full width of the container where it has been embedded.
Although height also accepts percentages, in most cases it is recommended to use a value in pixels, such as height="720", because it provides more predictable behaviour across all kinds of pages and content management systems.
Before inserting a timeline into another website, check its visibility. Private timelines are not intended to be shared or embedded.
Export
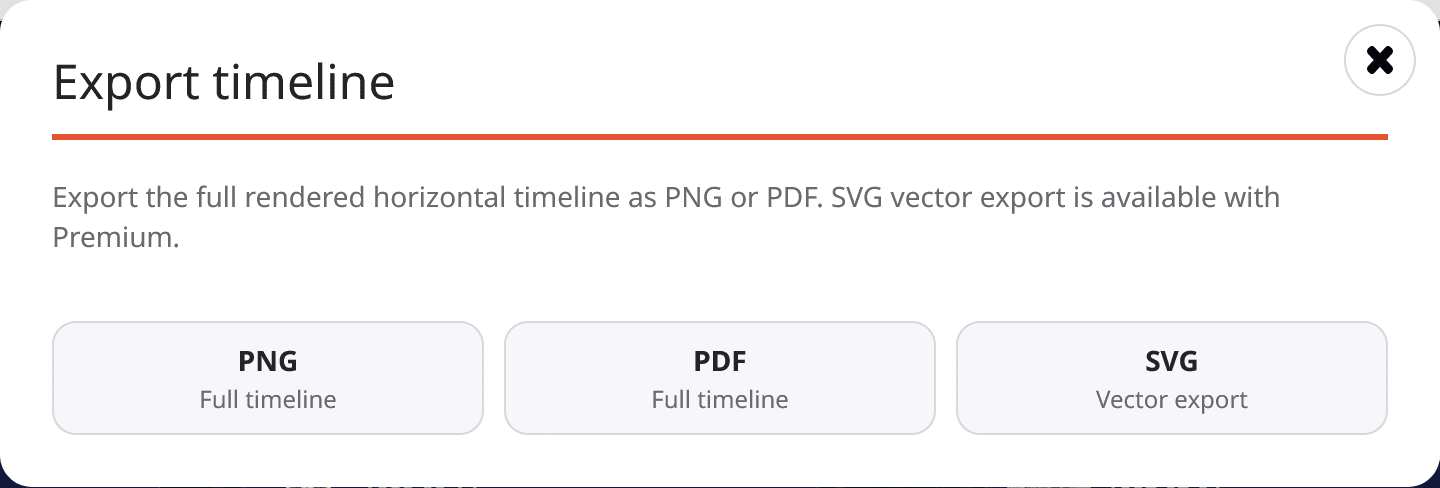
The Export option in the horizontal view allows you to generate a visual output of the timeline in PNG, PDF or SVG format, when the latter option is available according to the plan subscribed.
This export is part of the public viewing tools. It can be used from the horizontal view of an accessible timeline and is intended to obtain a graphical representation of the timeline being consulted.
It should not be confused with the CSV and ZIP options available on the editing page. Those export and import options are designed to work with the data of a timeline you own, make copies or import content from the editor.
The result of the visual export can vary greatly depending on the zoom level and the time range being displayed. It is therefore advisable to run several tests in PNG or PDF until you find the most suitable scale for your intended use.
The PNG format generates an image of the timeline. The PDF format generates a document that can be useful for saving, printing, sending or using in presentations and reports. The SVG format generates a vector export, suitable when a scalable image without loss of quality is needed; even so, the framing and visual layout will also depend on the zoom and range used.
Full screen
The Full screen mode hides the external elements of the page and puts the browser into full screen to offer a more immersive navigation experience.
In this mode, the entire available surface is dedicated to the timeline. The header buttons are not shown, but navigation through events and periods continues to work normally.
Full screen is designed to consult the timeline with as few distractions as possible, especially in presentations, classes, meetings, projections or reviews of extensive chronologies.
The experience is designed for different types of device, so the display adapts to the available screen size.